

Step 4: Modeling Rural Population within 2 km of All-Season Roads
This final step involves identifying the population within the buffered road network and calculating the indicator.
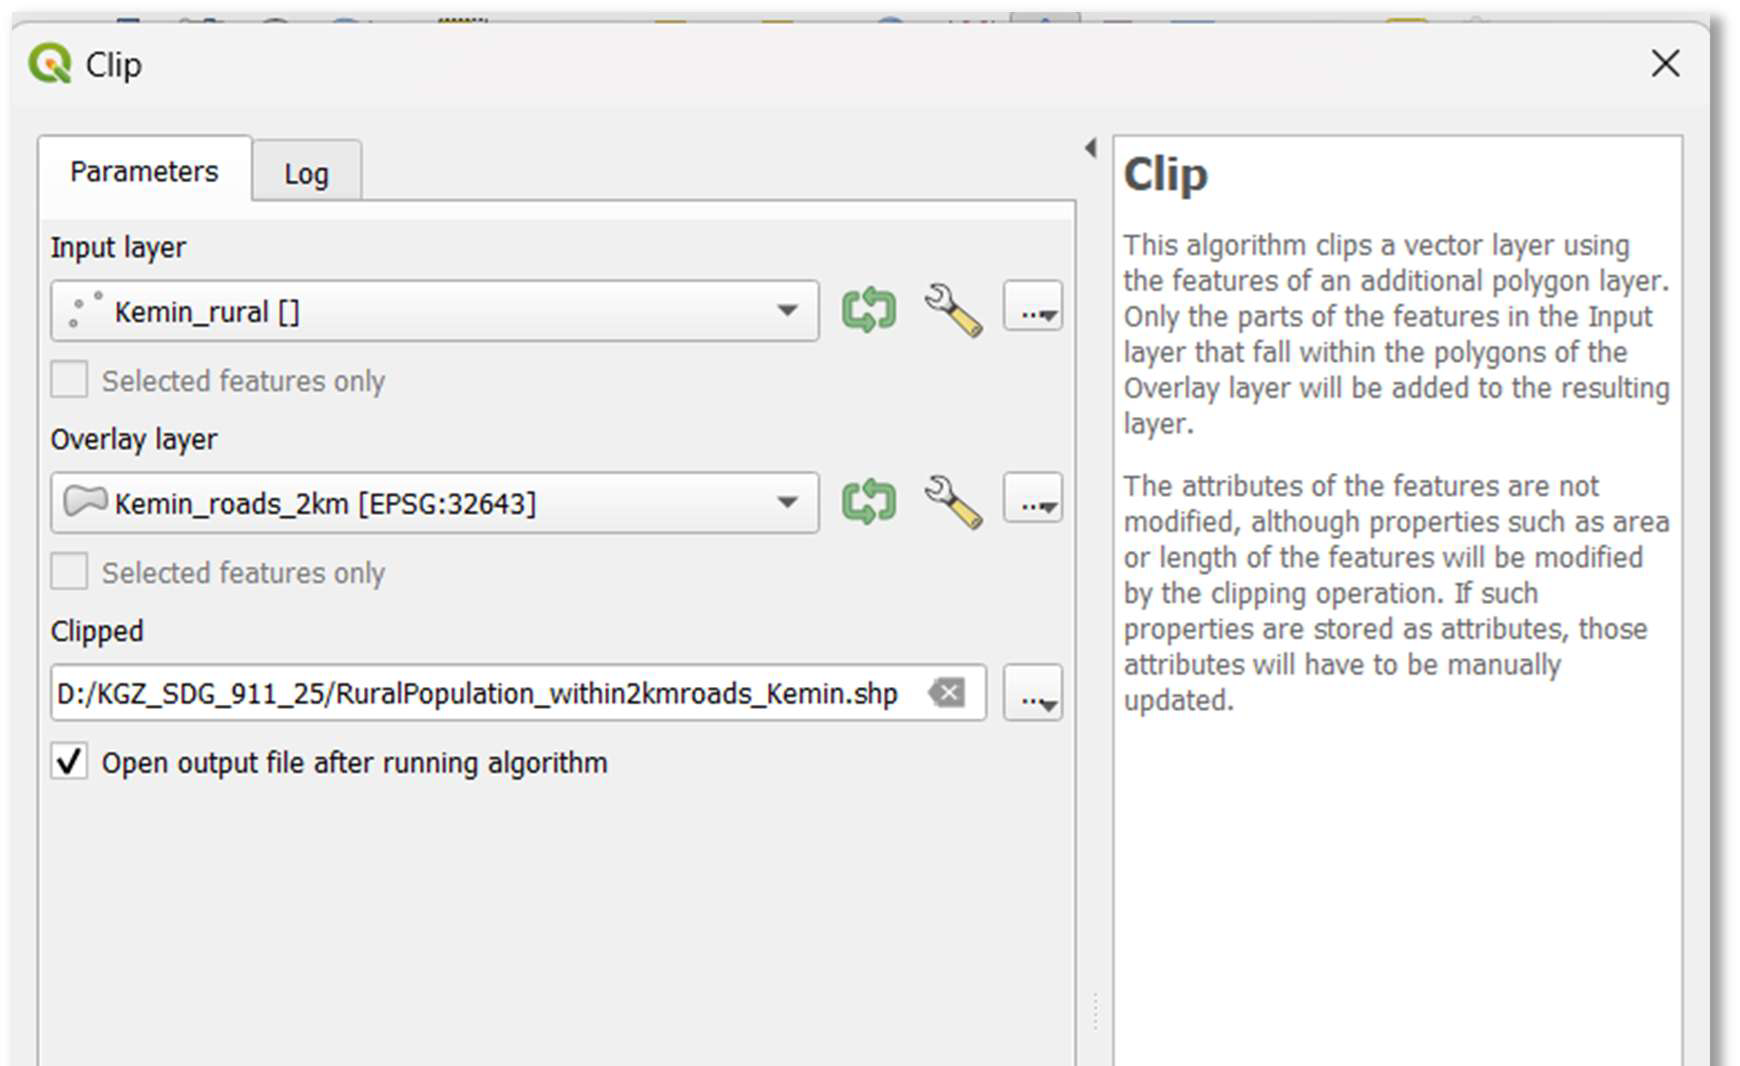
12. Identify rural population within road buffer: To estimate the rural population residing within 2 km of all-season roads, we will again use the Clip tool. This operation will isolate only those rural population points that fall within the buffered road network.
- Choose Vector > Geoprocessing Tools > Clip.
- Set ‘Input layer’ to your rural population layer for the analysis area (e.g., Kemin_rural.shp).
- Set ‘Overlay layer’ to your 2 km road buffer layer (e.g., Kemin_roads_2km.shp).
- Specify an ‘Output layer’ path and name (e.g., D:/SDG_911_Project/RuralPopulation_within2kmroads_Kemin.shp).
- Click ‘Run’.
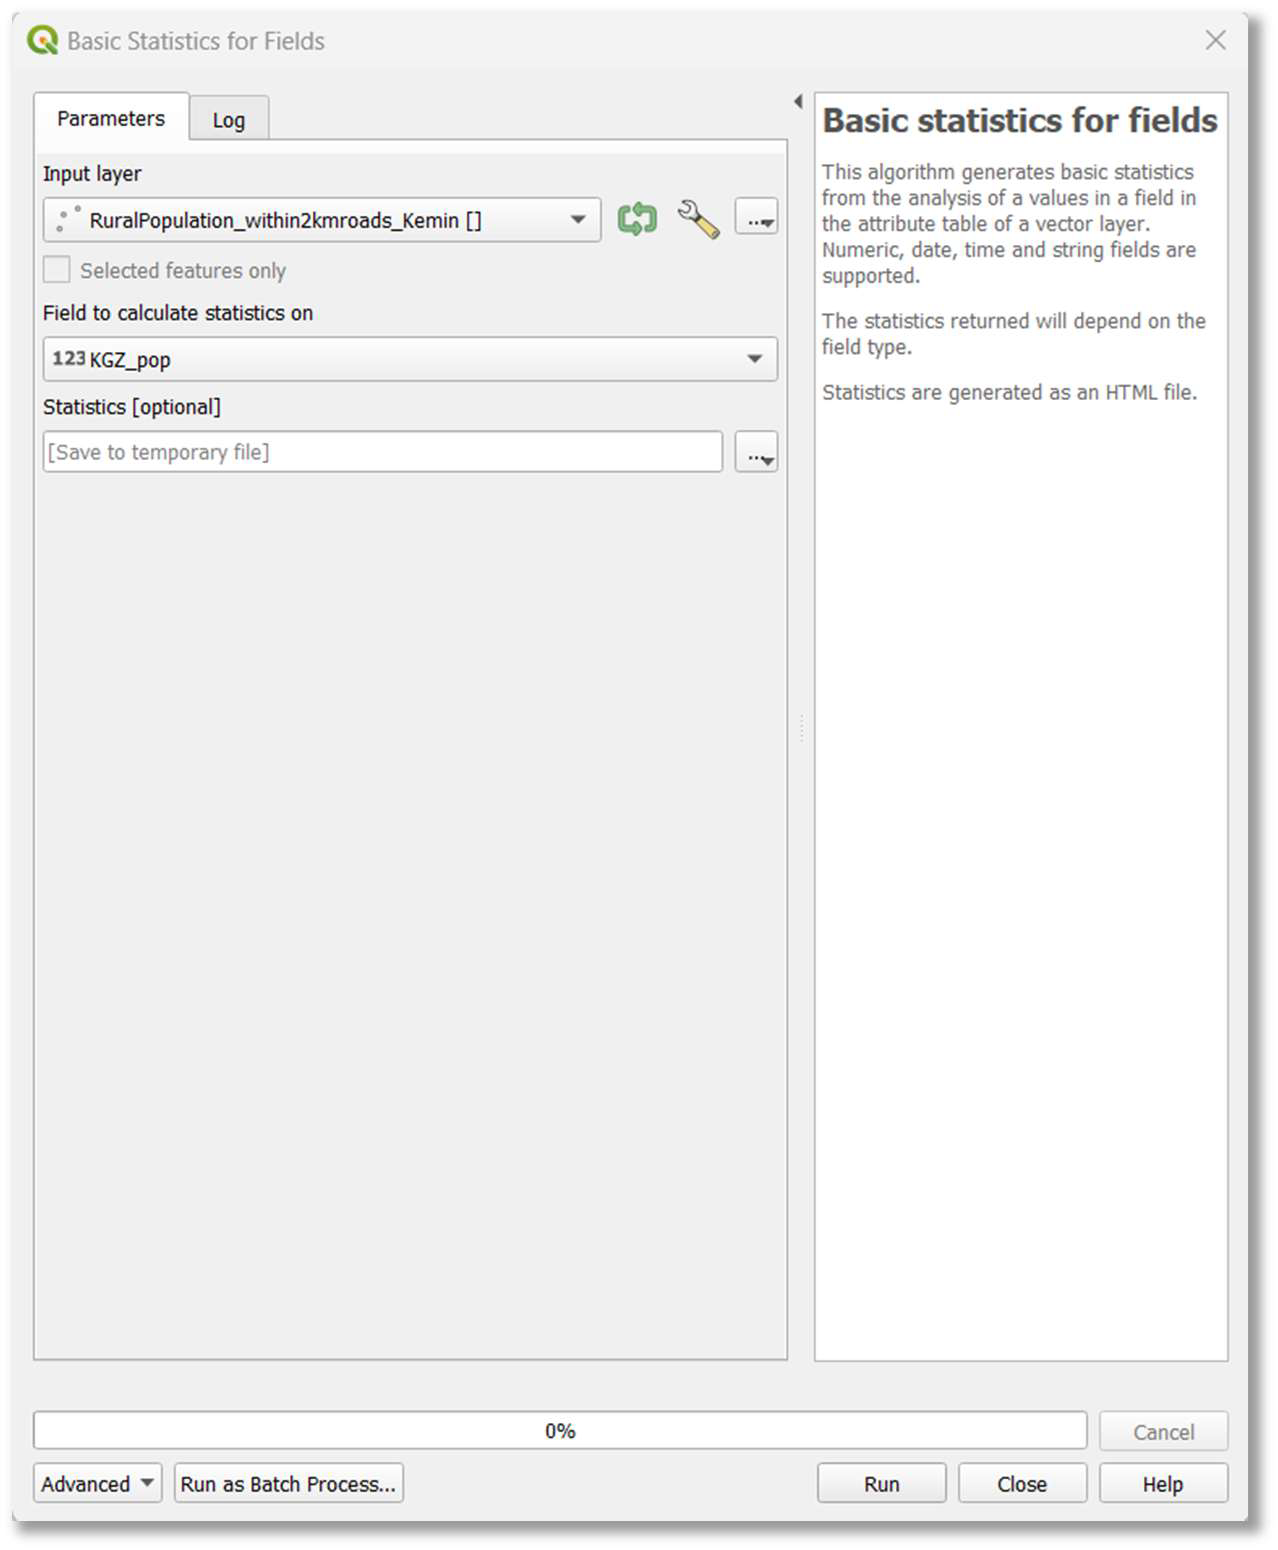
13. Calculate basic statistics for population (within buffer): To derive the total population within the 2 km buffer, we will use the “Basic statistics for fields” tool.
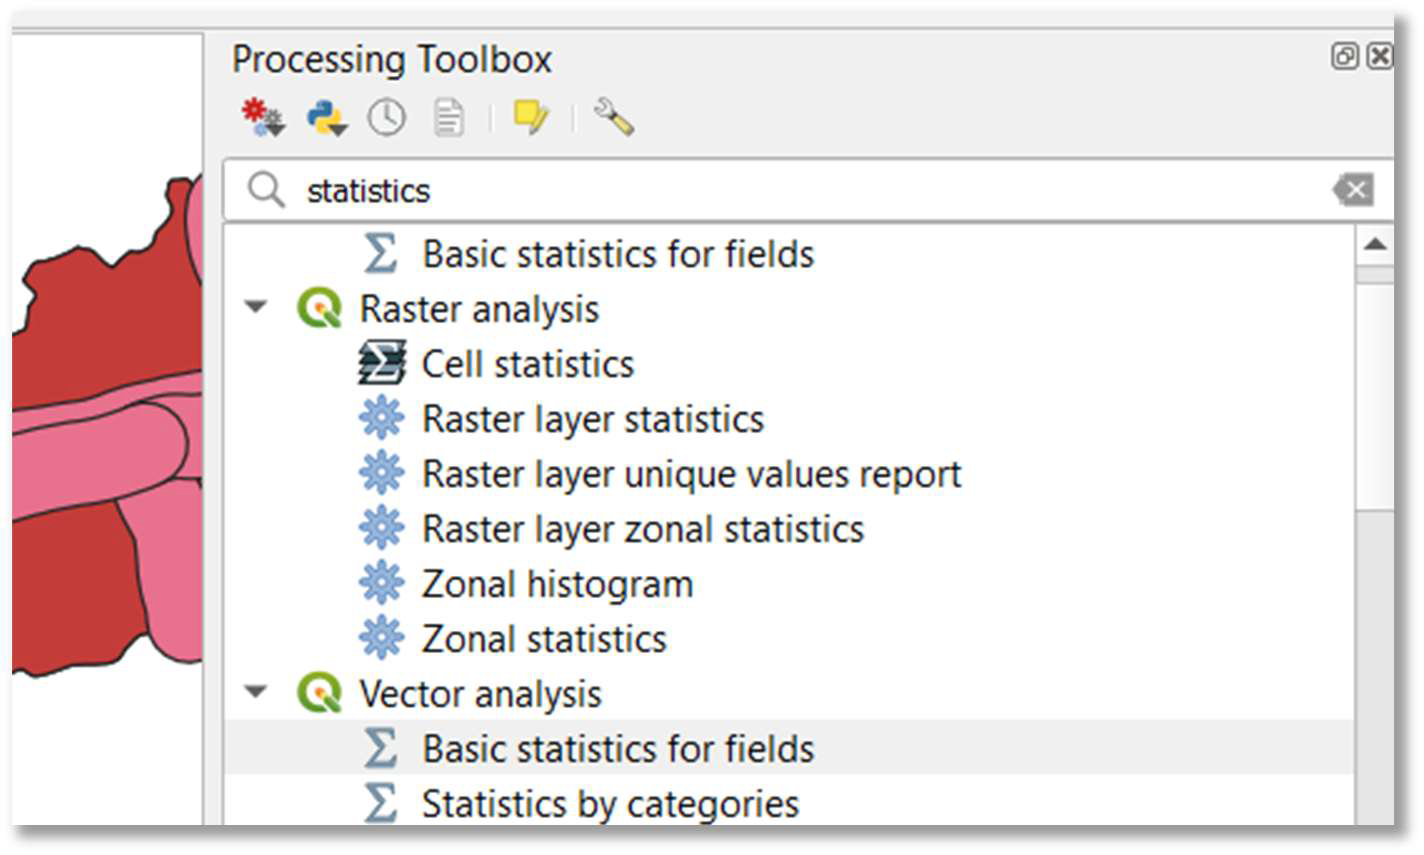
- In the ‘Processing Toolbox’ (accessible via Processing > Toolbox), search for “statistics” and choose Vector analysis > Basic statistics for fields.
- Set ‘Input layer’ to the layer created in the previous step (e.g., RuralPopulation_within2kmroads_Kemin.shp).
- Set ‘Field to calculate statistics on’ to your population attribute field (e.g., KGZ_pop).
- Keep ‘Statistics (optional)’ as default or select desired statistics.
- Click ‘Run’.
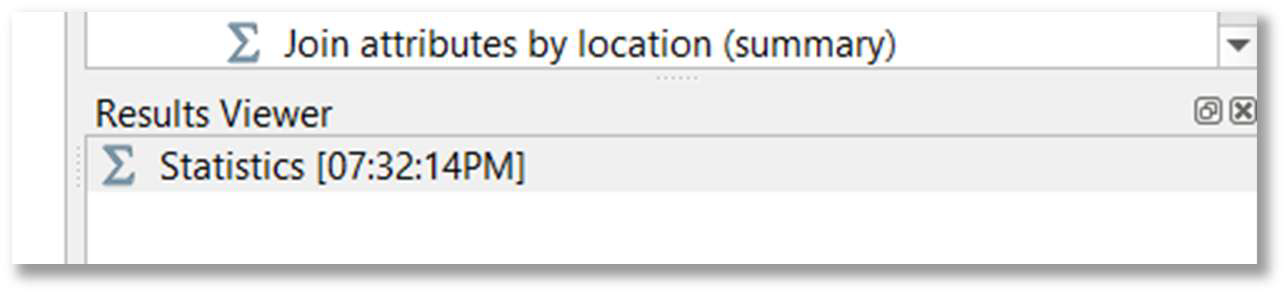
14. Review statistics (population within buffer): Open the generated HTML link in the ‘Results Viewer’ (or locate the temporary HTML file) to review the basic statistics for the population data within the 2 km all-season roads buffer. Note the ‘Sum’ value, which represents the total rural population within 2 km of an all-season road.
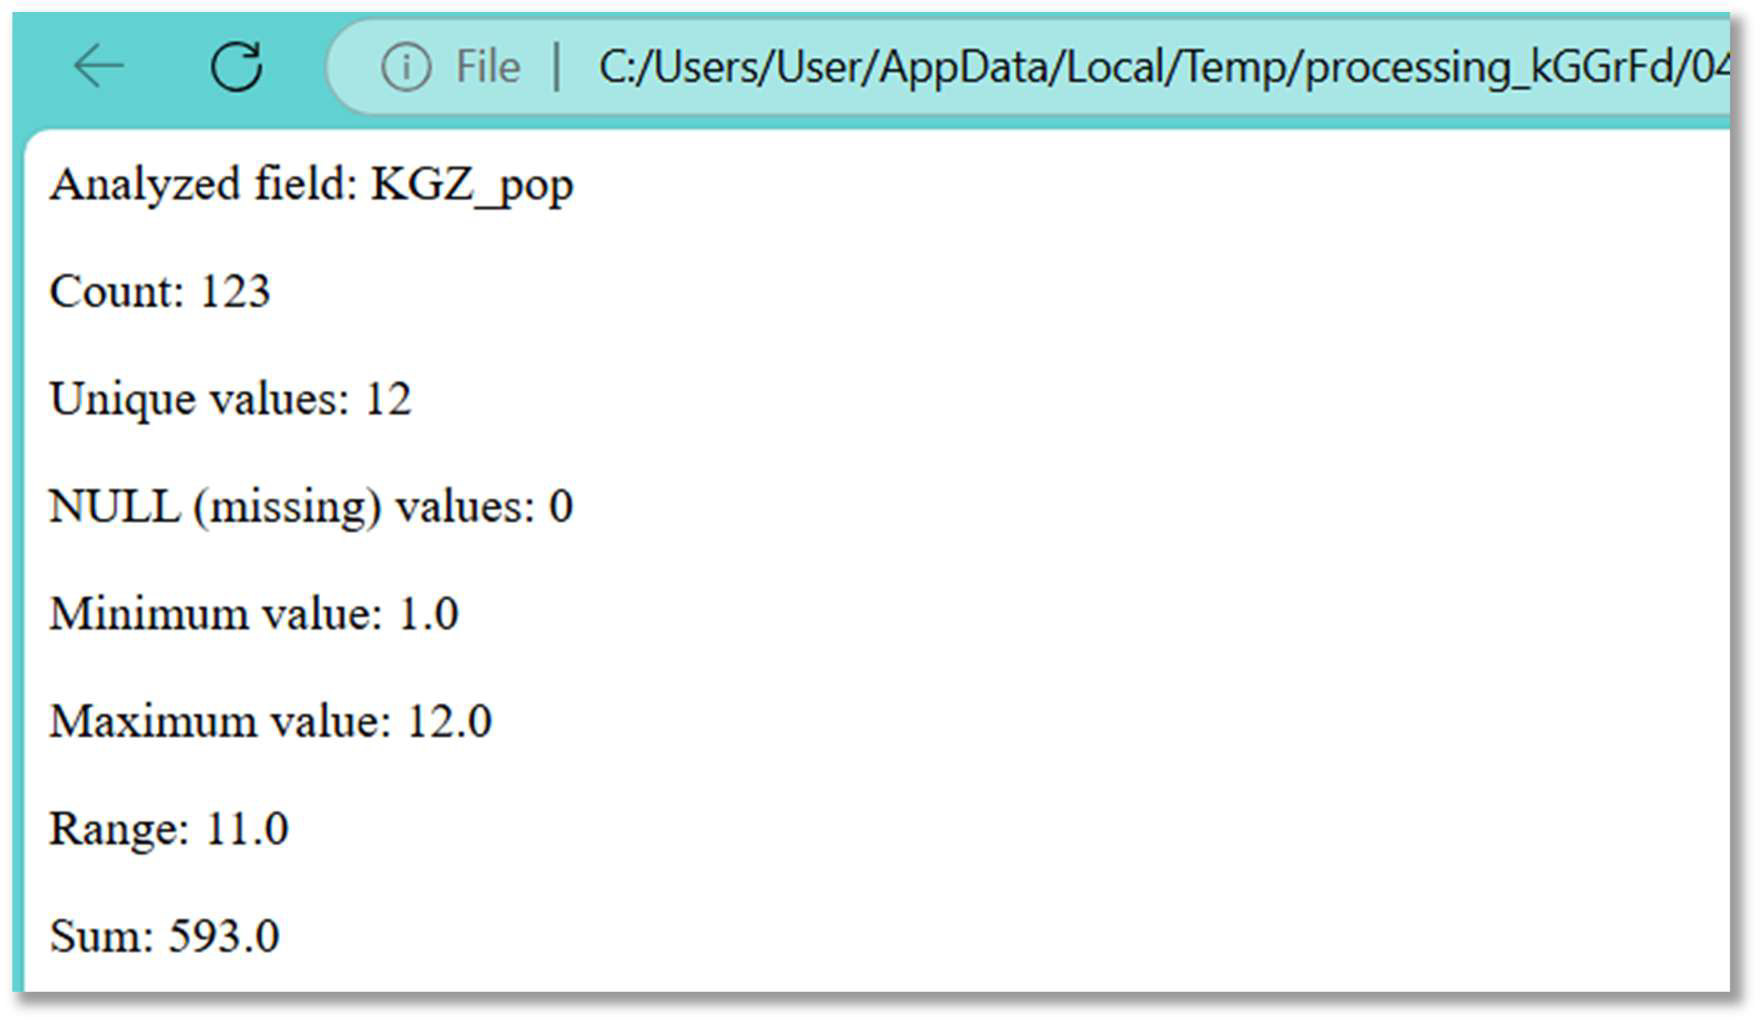
15. Generate statistics for total rural population (for analysis area): Next, calculate the total rural population for your entire analysis area (e.g., Kemin rayon) using the same “Basic statistics for fields” tool.
- Set ‘Input layer’ to your total rural population layer for the analysis area (e.g., Kemin_rural.shp).
- Set ‘Field to calculate statistics on’ to your population attribute field (e.g., KGZ_pop).
- Click ‘Run’.
- Note the ‘Sum’ value, which represents the total rural population in your defined analysis area.
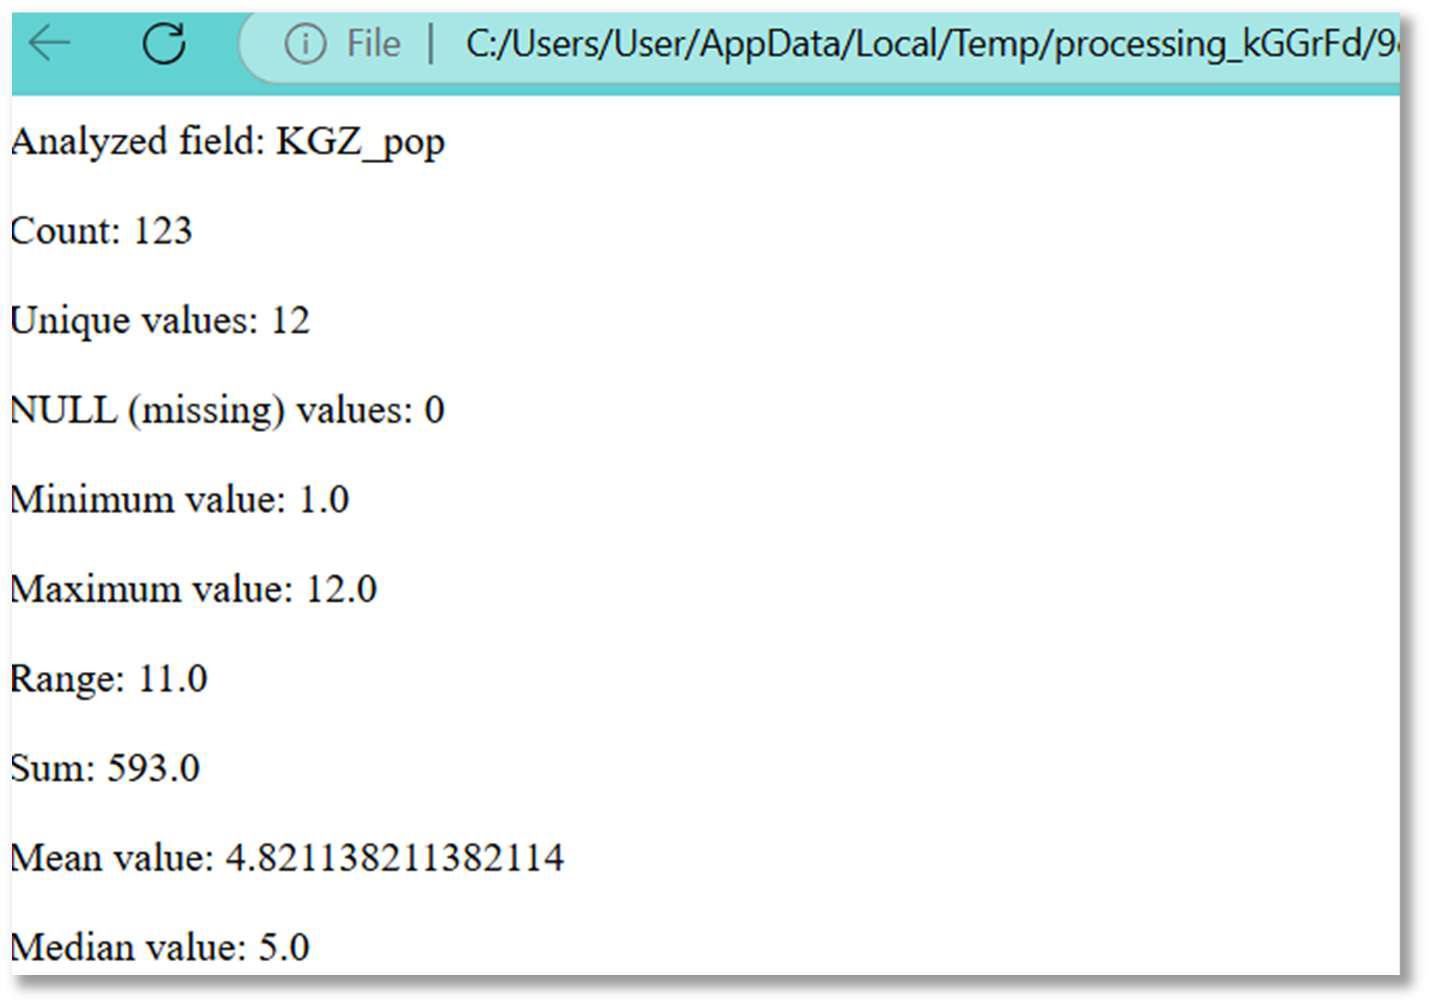
Calculating SDG Indicator 9.1.1: The SDG Indicator 9.1.1 is calculated as the ratio of the rural population living within 2 km of an all-season road to the total rural population.
Formula for SDG 9.1.1:
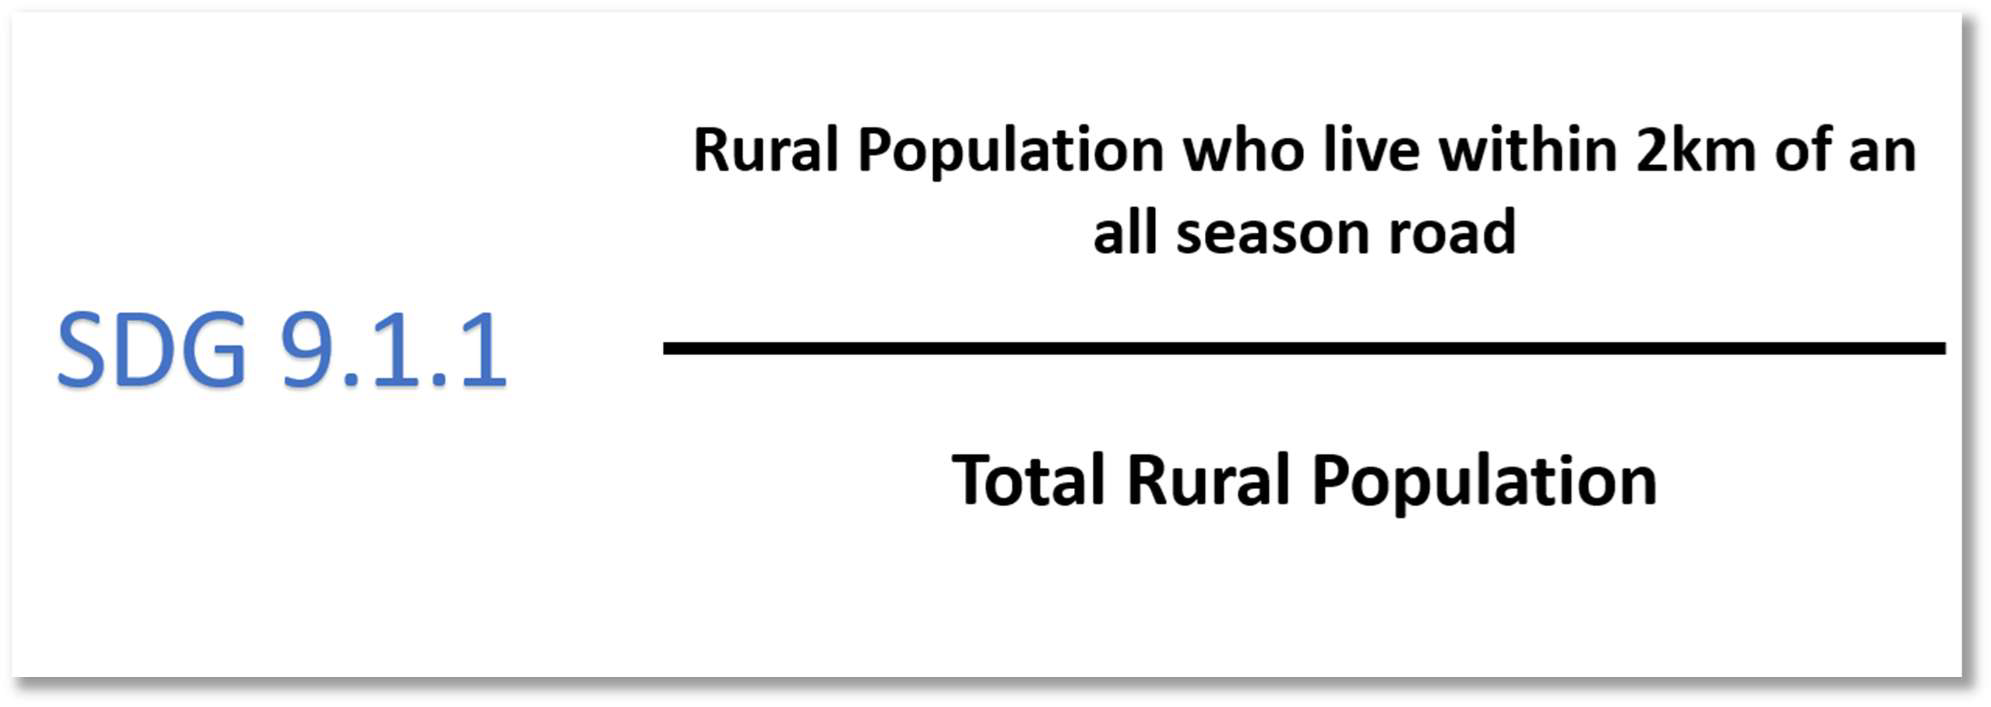
16. Perform calculation: Calculate the SDG indicator using the values obtained from the statistics in steps 14 and 15. For Kemin rayon using provided data:
- (1) Rural population within 2 km of an all-season road (from Step 14): 593.0
- (2) Total rural population (from Step 15): 593.0
- SDG 9.1.1 = (1)/(2) = 593.0/593.0 = 1
- This indicates that, in this specific example, all rural population in Kemin rayon lives within 2 km of an all-season road based on the input data.